Chapter 4 Missing values
The only dataset with missing values was the Trips by Distance data from the U.S. DOT Bureau of Transportation Statistics.
So, working with that set, let us find some NA’s
| level | na_s |
|---|---|
| Number of NA’s National: | 0 |
| Number of NA’s State: | 0 |
| Number of NA’s County: | 5779 |
We can see here that the NA values only occur at the county level. So, let’s find out where those NA’s are hiding.
##       Date              State.FIPS        State         County.FIPS
##  Min.   :2020-01-22   Min.   : 1.00   TX     :109474   Min.   : 1001
##  1st Qu.:2020-05-08   1st Qu.:18.00   GA     : 68529   1st Qu.:18177
##  Median :2020-08-24   Median :29.00   VA     : 57323   Median :29176
##  Mean   :2020-08-24   Mean   :30.28   KY     : 51720   Mean   :30384
##  3rd Qu.:2020-12-10   3rd Qu.:45.00   MO     : 49565   3rd Qu.:45081
##  Max.   :2021-03-27   Max.   :56.00   KS     : 45255   Max.   :56045
##                                       (Other):972336
##                County        Population.Staying.at.Home
##  Washington County:  12930   Min.   :     10
##  Jefferson County :  10775   1st Qu.:   2185
##  Franklin County  :  10344   Median :   5221
##  Jackson County   :   9913   Mean   :  25984
##  Lincoln County   :   9913   3rd Qu.:  15053
##  Madison County   :   8189   Max.   :4131225
##  (Other)          :1292138   NA's   :5779
##  Population.Not.Staying.at.Home Number.of.Trips    Number.of.Trips..1
##  Min.   :    117                Min.   :     227   Min.   :       0
##  1st Qu.:   8826                1st Qu.:   37386   1st Qu.:    8051
##  Median :  20719                Median :   88712   Median :   19530
##  Mean   :  78593                Mean   :  325210   Mean   :   82383
##  3rd Qu.:  54017                3rd Qu.:  231308   3rd Qu.:   52890
##  Max.   :8636354                Max.   :43031242   Max.   :12335889
##  NA's   :5779                   NA's   :5779       NA's   :5779
##  Number.of.Trips.1.3 Number.of.Trips.3.5 Number.of.Trips.5.10 Number.of.Trips.10.25
##  Min.   :       0    Min.   :      0     Min.   :      0      Min.   :      0
##  1st Qu.:    8345    1st Qu.:   3548     1st Qu.:   4909      1st Qu.:   5829
##  Median :   21520    Median :   9989     Median :  12433      Median :  13901
##  Mean   :   80587    Mean   :  39327     Mean   :  49127      Mean   :  47670
##  3rd Qu.:   57947    3rd Qu.:  28213     3rd Qu.:  34078      3rd Qu.:  35061
##  Max.   :11401040    Max.   :5423126     Max.   :6535454      Max.   :5844180
##  NA's   :5779        NA's   :5779        NA's   :5779         NA's   :5779
##  Number.of.Trips.25.50 Number.of.Trips.50.100 Number.of.Trips.100.250
##  Min.   :      0       Min.   :     0         Min.   :     0
##  1st Qu.:   3013       1st Qu.:  1184         1st Qu.:   424
##  Median :   6412       Median :  2598         Median :   967
##  Mean   :  16454       Mean   :  6086         Mean   :  2678
##  3rd Qu.:  14435       3rd Qu.:  5742         3rd Qu.:  2301
##  Max.   :1859953       Max.   :555732         Max.   :356594
##  NA's   :5779          NA's   :5779           NA's   :5779
##  Number.of.Trips.250.500 Number.of.Trips...500
##  Min.   :    0.0         Min.   :     0.0
##  1st Qu.:   57.0         1st Qu.:    11.0
##  Median :  166.0         Median :    41.0
##  Mean   :  574.5         Mean   :   323.7
##  3rd Qu.:  442.0         3rd Qu.:   150.0
##  Max.   :90947.0         Max.   :125691.0
##  NA's   :5779            NA's   :5779
From the summary we can see that there is an equal 5779 NA’s for each numeric column thus, upon further inspection, 5779 rows are fully incomplete for trips data. So, let’s isolate those rows.
Frist, since this data is a timeseries, let’s check the dates to see if there is a pattern.
| Date | count |
|---|---|
| 2021-03-26 | 1228 |
| 2020-11-29 | 113 |
| 2020-09-06 | 101 |
| 2020-07-04 | 99 |
| 2020-07-03 | 93 |
| 2020-07-02 | 91 |
| 2020-09-07 | 88 |
| 2020-07-01 | 87 |
| 2020-06-30 | 85 |
| 2020-06-29 | 79 |
From this we see the vast majority of NA occur on 2021-03-26, which is one day before the ending day of the dataset. Thus, we can conclude that the rows for second to last day have been created for data input but have not updated by the time of data procurement. Thus, removing the last two days from the dataset will reduce potential error and will not affect analysis of mobility on COVID-19 rates from January 2020 to March 2021. Now to get the total number of days in the dataset.
## Time difference of 428 daysHere we can see that there are 428 total days in the dataset so, lets narrow down the search to counties with > 10% of missing data. (10% is chosen because 90% of available data could still provide accurate insights for trips data) here is a sample:
| State | County | n |
|---|---|---|
| AK | Aleutians East Borough | 62 |
| AK | Bristol Bay Borough | 353 |
| AK | Haines Borough | 101 |
| AK | Lake and Peninsula Borough | 295 |
| AK | Skagway Municipality | 141 |
| AK | Yakutat City and Borough | 395 |
There are 22 counties with high rates of NA values. Thus, these are the counties that could be most problematic when analyzing at a county scale. So, lets save the data frame of these top NA violators for future reference when further micro analysis is desired within these areas.
Now to consider, would the NA values from certain counties affect State level analysis? To find out let’s plot the states with county NA values.
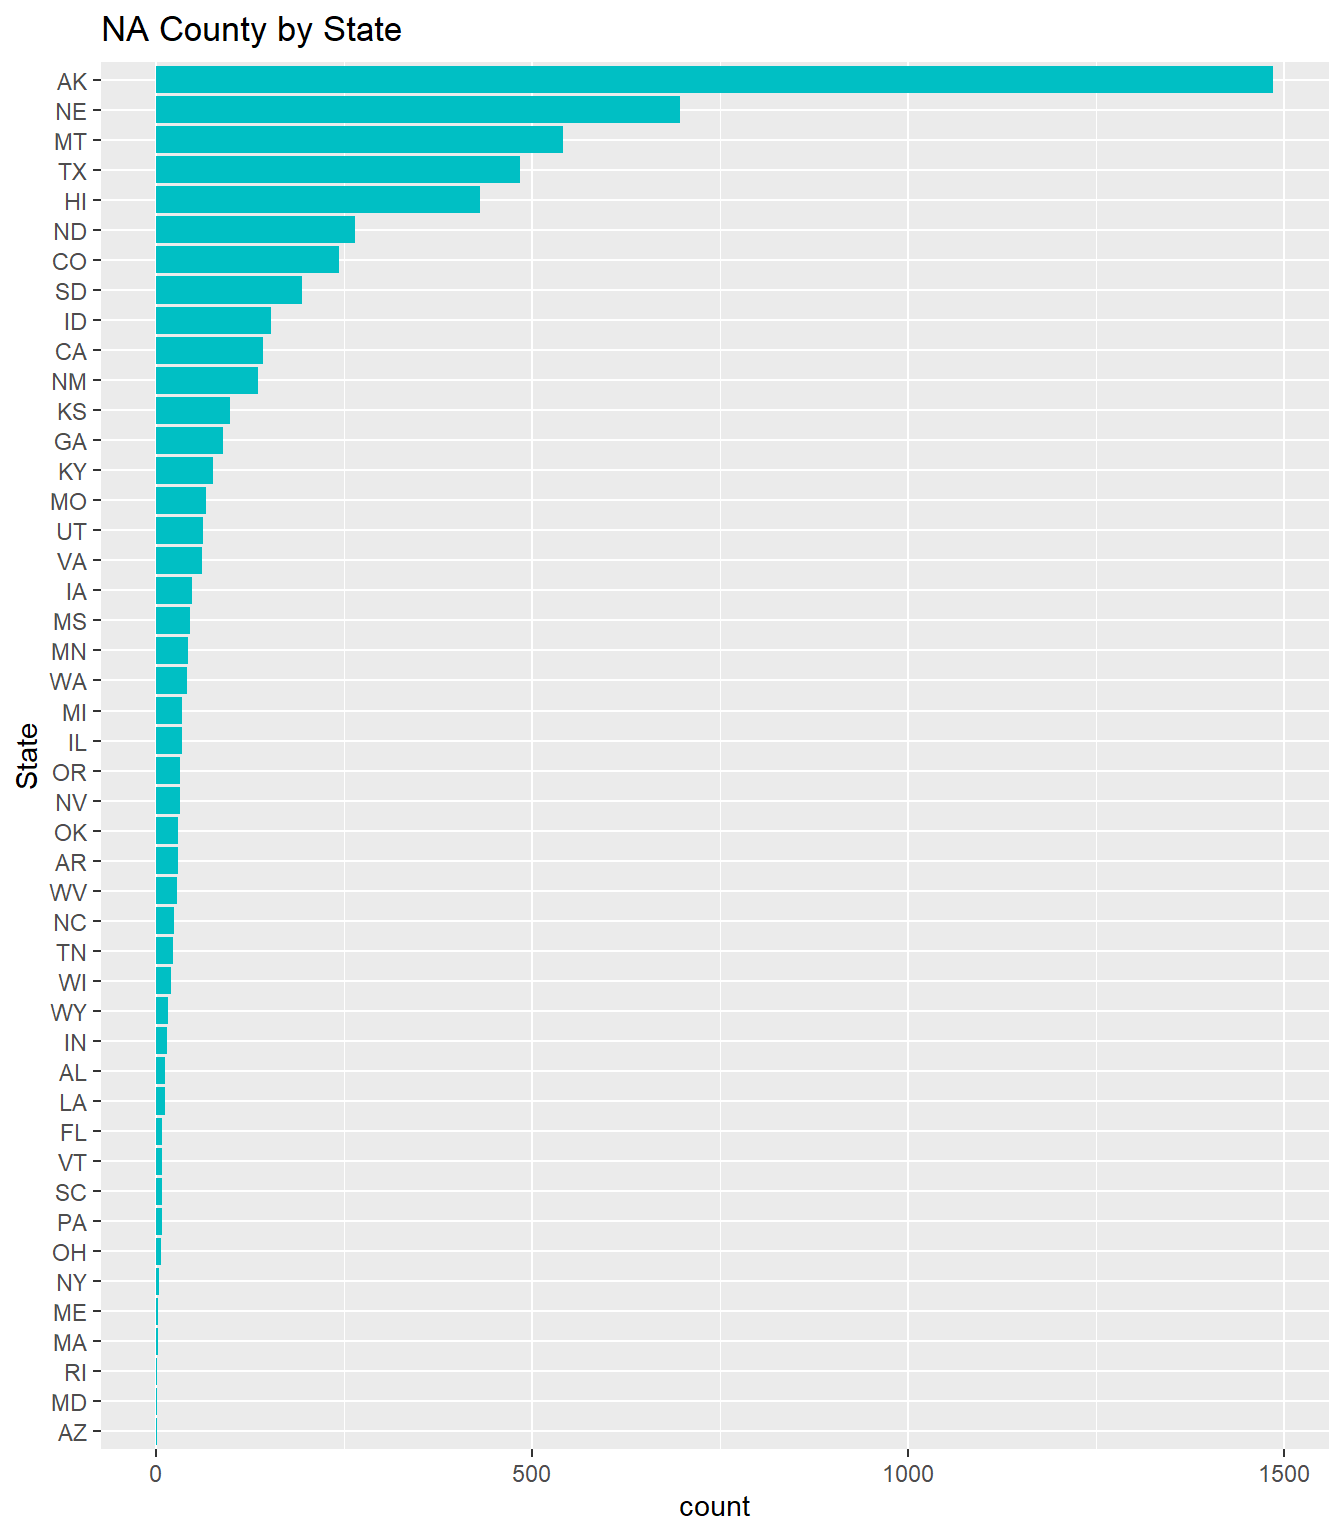
Here we can see the states with the majority of the NA values, lets pick the top 5 (AK, NE, MT, TX, HI) and see how much the NA values might impact the aggregate state values.
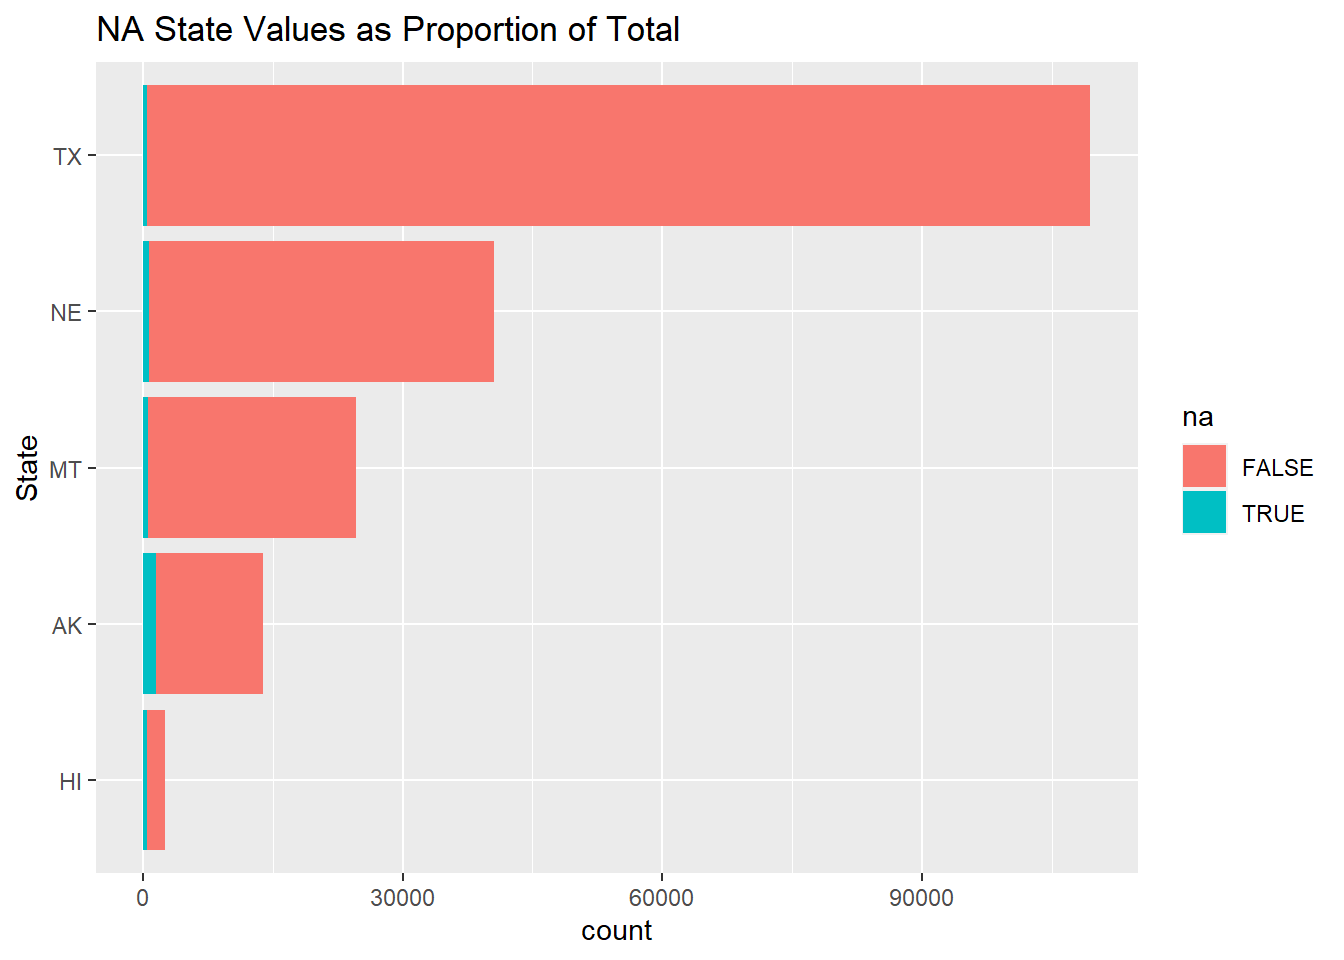
We can see by the above stacked bar plot that the NA values account for a negligible amount of total values from each of the top NA states. Thus, the NA values should be of note, but of not much concern when considering total trips by distance for each state.
With this analysis of NA values, the decision to leave the NA rows in the dataset is made for continuity of county timelines.